

Swim Metrics Explained: What to Track to Get Faster
/When swimmers ask me how to measure progress, they usually start with one number: time.
Time matters. It tells you who reached the wall first. But it does not explain why one swim was faster, why your stroke fell apart at the end of a set, or why more effort did not produce more speed.
That is where swim metrics become useful.
The right metrics help you connect the outcome - your time - with the process that produced it. They can show whether you are holding pace, maintaining stroke length, creating useful propulsion, or simply working harder without moving faster.
The goal is not to collect every number your watch can produce. It is to measure the few things that help you make better training decisions. Excellence lives in the fundamentals, and data is most valuable when it brings those fundamentals into focus.
What Are Swim Metrics?
Swim metrics are measurements used to evaluate speed, efficiency, workload, technique, and consistency in the water. Some are easy to record with a pace clock and a stroke count. Others require a watch, video, or specialized sensors.
The most useful swimming performance metrics include:
Pace and lap splits
Stroke count
Stroke rate
Distance per stroke
SWOLF
Pace and stroke consistency
Heart rate and perceived effort
Training volume and workout density
Stroke power and propulsive force
Hand velocity, stroke path, and left-to-right balance
No single metric gives you the complete answer. A lower stroke count is not automatically better. A higher stroke rate is not automatically faster. Even a personal-best time does not tell you whether the improvement came from better technique, stronger walls, improved fitness, or a more effective race strategy.
That is why good analysis looks at relationships between measurements rather than chasing one perfect number.
| Swim metric | What it tells you | Best use |
|---|---|---|
| Pace and splits | How fast you are swimming | Race preparation and set execution |
| Stroke count | How many strokes you take per length | Tracking changes in stroke length and efficiency |
| Stroke rate | How quickly you cycle your arms | Evaluating tempo and race rhythm |
| Distance per stroke | How far you travel with each stroke | Assessing effective stroke length |
| SWOLF | Combines time and stroke count | Monitoring personal efficiency trends |
| Pace consistency | How well you maintain speed | Identifying fatigue and pacing problems |
| Heart rate and RPE | Internal training demand | Monitoring intensity and recovery |
| Volume and density | Total work and work completed per unit of time | Managing training load |
| Power and propulsion | How much useful force the stroke produces | Advanced performance analysis |
| Stroke balance and path | How each arm applies force through the water | Finding asymmetries and technical leaks |
1. Pace and Lap Splits
Pace is the most direct measure of swimming performance. It is commonly expressed as time per 25, 50, or 100 yards or meters. Splits break a longer swim into smaller segments so you can see how your speed changed throughout the effort.
If you swim a 200 freestyle, the final time gives you the outcome. Your 50 splits tell you how you created it.
Did you go out too fast and fade? Did you hold a steady pace? Did you finish faster than you started? Two swimmers can record the same final time using very different pacing strategies.
Splits are especially helpful during descending sets, threshold work, and race-pace training. When I prescribe race-pace work, I want the swimmer to know more than whether the repetition felt hard. I want to know whether the target speed was achieved and whether it remained repeatable.
Learn more about finding and training your ideal swimming race pace.
2. Stroke Count
Stroke count is the number of arm strokes you take to complete one length. Count each hand entry as one stroke and use the same method every time.
Stroke count can help show whether you are maintaining your length through the water. If you swim the same pace with fewer strokes, you may be traveling farther with each stroke. If your stroke count rises late in a set while your pace slows, fatigue may be shortening your stroke or weakening your hold on the water.
However, lower is not always better.
I often see swimmers chase a low stroke count by pausing in front, over-gliding, or kicking harder. The number improves, but the swimmer loses rhythm and sometimes moves more slowly. Stroke count only becomes meaningful when you compare it with time, effort, and technique.
The practical question is not, “How few strokes can I take?” It is, “How effectively can I maintain my stroke while swimming at the required speed?”
3. Stroke Rate
Stroke rate measures how quickly you complete your stroke cycle, usually reported as strokes or cycles per minute. Check how your device defines the measurement because watches and sensors may count strokes differently.
Speed depends partly on the relationship between stroke rate and distance per stroke. Increase the rate too much without holding water effectively and you may spin your arms without producing more speed. Focus only on length and you may develop a slow, disconnected stroke with too much glide.
Sprinters generally need a higher rate than distance swimmers, but every swimmer has an effective range based on the event, stroke, body structure, technical ability, and level of fatigue.
Track stroke rate alongside pace. If your rate rises but your pace does not improve, you may be losing distance per stroke or directing force poorly. If your rate falls late in a race while the effort feels maximal, fatigue may be limiting your ability to maintain rhythm.
4. Distance per Stroke
Distance per stroke describes how far you travel with each stroke. A simple pool calculation divides the distance covered by the number of strokes taken, although walls and underwater travel make this an estimate.
To compare sessions more accurately, use the same pool length and keep your push-offs, breakouts, stroke, equipment, and effort consistent.
Distance per stroke helps evaluate how effectively you move through the water, but it should not be confused with passive gliding. Productive stroke length comes from body position, timing, a connected catch, and force directed backward. It does not come from waiting longer between strokes.
This is where video can add important context. A number may show that your distance per stroke changed, while swimming video analysis can help reveal whether the change came from a stronger catch, a longer glide, a different breakout, or another technical adjustment.
5. SWOLF
SWOLF combines lap time in seconds with stroke count for the same length.
SWOLF = lap time + stroke count
For example, swimming 25 yards in 18 seconds with 20 strokes produces a SWOLF score of 38.
SWOLF is useful because it connects speed with stroke economy. It is best used to compare your own swims under similar conditions. Pool length, stroke, height, underwater distance, fatigue, and the way a device counts strokes can all influence the score.
A lower SWOLF does not always mean better swimming. You can lower the score by slowing down and taking fewer strokes, even if that does not support your performance goal. Use it as a trend, not a universal ranking.
For a deeper explanation, see SWOLF in Swimming: How to Calculate It and Use It to Get Faster.
6. Pace and Stroke Consistency
Averages can hide the most useful part of a set.
Suppose you complete eight 50s with an average time of 32 seconds. That sounds consistent until you see that the first repetition was 29 and the last was 35. The average does not show how quickly performance deteriorated.
Track the range between your fastest and slowest repetitions. You can also note how stroke count or stroke rate changes as the set progresses. This helps reveal when technique begins to break down under fatigue.
Consistency matters because racing is not about producing one good stroke. It is about preserving effective mechanics as speed, fatigue, and pressure increase.
7. Heart Rate and Perceived Effort
Heart rate provides information about internal training demand. It can be useful for aerobic work, recovery monitoring, and comparing how your body responds to similar sets over time.
However, swimming heart rate is not always as easy to interpret as cycling or running data. Wrist readings can be inconsistent in water, and it is difficult to check a watch while maintaining stroke rhythm. Heart rate also responds with a delay during short repetitions.
I recommend pairing heart rate with rating of perceived exertion, or RPE. A simple 1–10 scale works well:
2–3: Easy and conversational
4–5: Controlled aerobic effort
6–7: Strong and sustainable
8–9: Very hard, race-oriented effort
10: Maximal effort
If a familiar pace suddenly requires a much higher heart rate or RPE, recovery, illness, heat, accumulated fatigue, or poor fueling may be affecting the session. One unusual reading is not a diagnosis. Look for repeatable patterns.
8. Training Volume and Workout Density
Training volume is the total distance completed during a workout, week, or training phase. It provides context, but more yardage does not automatically mean better training.
Workout density measures how much work you complete within a given amount of time. Swimming 3,000 yards in 60 minutes with short rests creates a different demand than covering the same distance in 90 minutes with longer recovery and more speed work.
Track volume and density to understand workload, not to compete for the biggest number. The correct amount depends on your event, training age, technical level, schedule, recovery capacity, and phase of the season.
The useful question is whether the workload supports the goal of the session while allowing you to preserve the intended quality.
9. Stroke Power and Propulsive Force
Traditional metrics tell us what happened. Advanced stroke analysis can help explain how it happened.
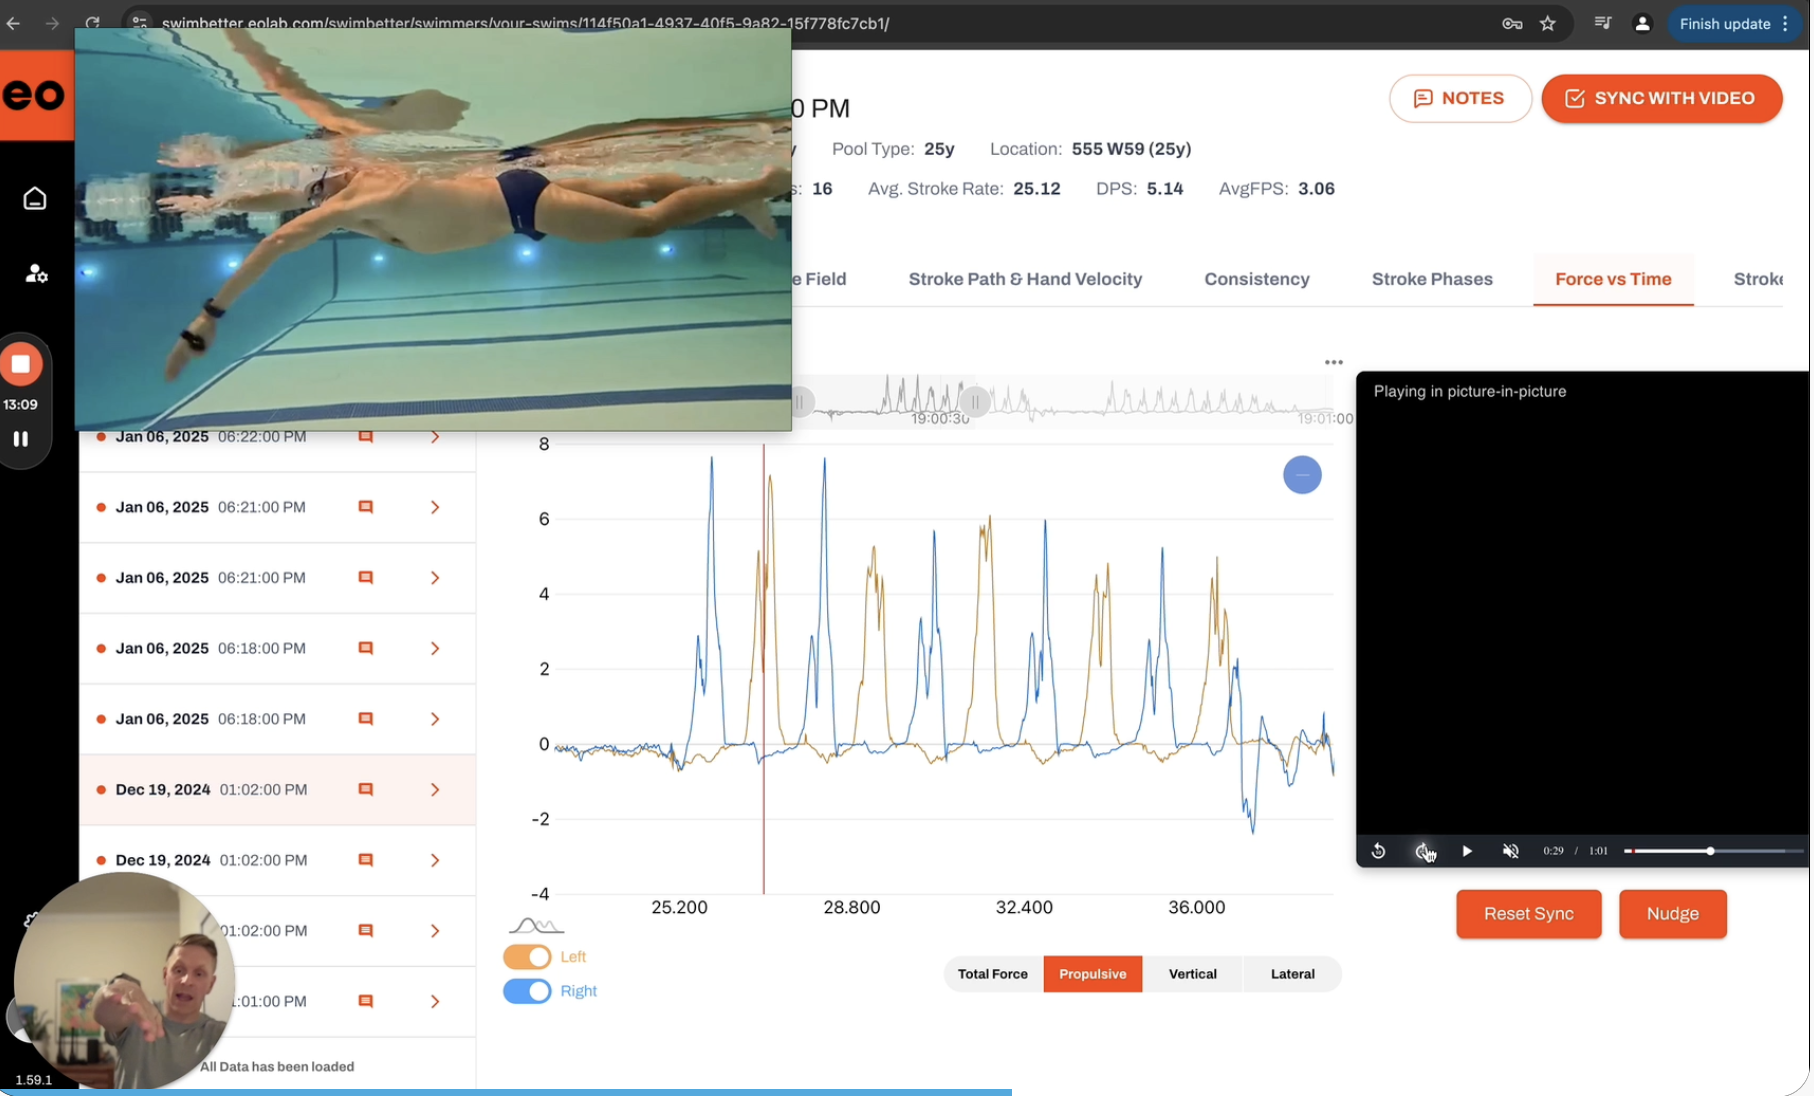
Stroke power reflects how much work you are producing through the pull. Propulsive force examines how much of that effort contributes to moving you forward. Those are not always the same thing.
A swimmer can apply a large amount of force but direct part of it sideways or downward. In that situation, more effort may not create proportionally more speed. Better hand and forearm orientation, timing, or stroke path may improve how that force is used.
This is why “pull harder” is often incomplete advice. The goal is to apply force in a direction and at a time that supports forward movement.
Read more about what propulsion in swimming really means.
10. Hand Velocity, Stroke Path, and Left-to-Right Balance
Hand velocity shows how the hand accelerates through different parts of the stroke. Stroke path shows where the hand travels and how the swimmer organizes the catch, pull, and finish.
Left-to-right balance compares how each arm produces and directs force. Some asymmetry is normal, especially when breathing or when an athlete has a long training history. The goal is not perfect visual symmetry. The goal is to identify differences that reduce propulsion, disrupt timing, or become more pronounced under fatigue.
With EO SwimBETTER Performance Analysis, I can examine stroke power, propulsive force, hand velocity, stroke path, balance, and stroke-to-stroke consistency. When appropriate, I combine that information with underwater video so we can connect what the stroke looks like with what it actually produces.
The technology provides many data points, but more data is not automatically more useful. I focus on the few patterns most likely to improve the swimmer’s performance.
How to Use Swim Metrics Together
The clearest answers usually appear when two or three metrics are viewed together.
| What the data shows | What it may suggest |
|---|---|
| Faster pace with a similar stroke count | Better speed without sacrificing stroke length |
| Higher stroke rate with no pace improvement | Shorter strokes, slipping water, or poorly directed force |
| Rising stroke count and slower splits | Technique breaking down under fatigue |
| Stable pace with lower RPE | Improved fitness or economy |
| More power with little additional speed | Added force may not be producing useful propulsion |
| Growing left-to-right difference | Fatigue, timing changes, or a technical imbalance |
These patterns are starting points, not automatic conclusions. Video, coaching observation, training history, and the purpose of the set still matter.
A Simple Swim Metrics Test
You do not need advanced equipment to establish a useful baseline. Try this during a normal training week:
Complete your usual warm-up.
Swim 6×50 at a strong but controlled effort with consistent rest.
Record the time and stroke count for every repetition.
Note your RPE after each 50.
If available, record stroke rate and heart rate.
Repeat the same test several weeks later under similar conditions.
Look for more than the fastest repetition. Ask:
Did the pace become more consistent?
Could you hold the same time with fewer strokes?
Did the same pace feel easier?
Did your stroke count remain stable late in the set?
Did increasing stroke rate actually make you faster?
That information is far more useful than comparing one random watch summary with another.
Common Mistakes When Tracking Swimming Performance
Comparing your numbers with another swimmer
Height, limb length, stroke, speed, pool length, and underwater distance all affect the numbers. Your trends are usually more valuable than someone else’s benchmark.
Changing too many conditions
Do not compare a pull set in a 25-yard pool with a full-stroke set in a 50-meter pool and assume the difference represents progress. Keep testing conditions consistent.
Chasing a lower stroke count
Fewer strokes can be useful, but not when they come from over-gliding or losing speed.
Trusting the watch without checking it
Wearables can miss a length, misidentify a stroke, or count strokes differently. Use the data as feedback and compare it with the pace clock and your own observations.
Collecting data without changing anything
A metric is only valuable when it informs a decision. If the number does not affect your technique, pacing, training, or recovery, you probably do not need to track it every day.
Measure What Matters
You do not need a dashboard full of numbers to become a better swimmer. Start with pace, stroke count, and perceived effort. Add stroke rate, SWOLF, or heart rate when those measurements answer a specific training question.
For competitive swimmers, advanced metrics can take the analysis further by showing how much power the stroke produces, where that force is directed, and what changes as fatigue develops.
The number is never the goal by itself. The goal is to understand your swimming well enough to make the next practice more purposeful.
If you are training consistently but cannot identify what is limiting your speed, EO SwimBETTER Performance Analysis combines objective stroke data with experienced coaching interpretation. We identify the metrics that matter most, connect them to your technique, and turn the findings into clear priorities for your training.
Train with precision. Measure what matters. Swim faster.
About Dan Daly
Dan Daly, CSCS, is a swim coach and strength and conditioning specialist with more than 20 years of coaching experience. A former collegiate All-American swimmer, he works with high school, collegiate, masters, open-water, and triathlete swimmers through technique coaching, performance analysis, and swimmer-specific strength training.